Hail history in Massachusetts
We counted the days with NOAA hail reports within 15 miles of the center of 3 Massachusetts cities since 2010.
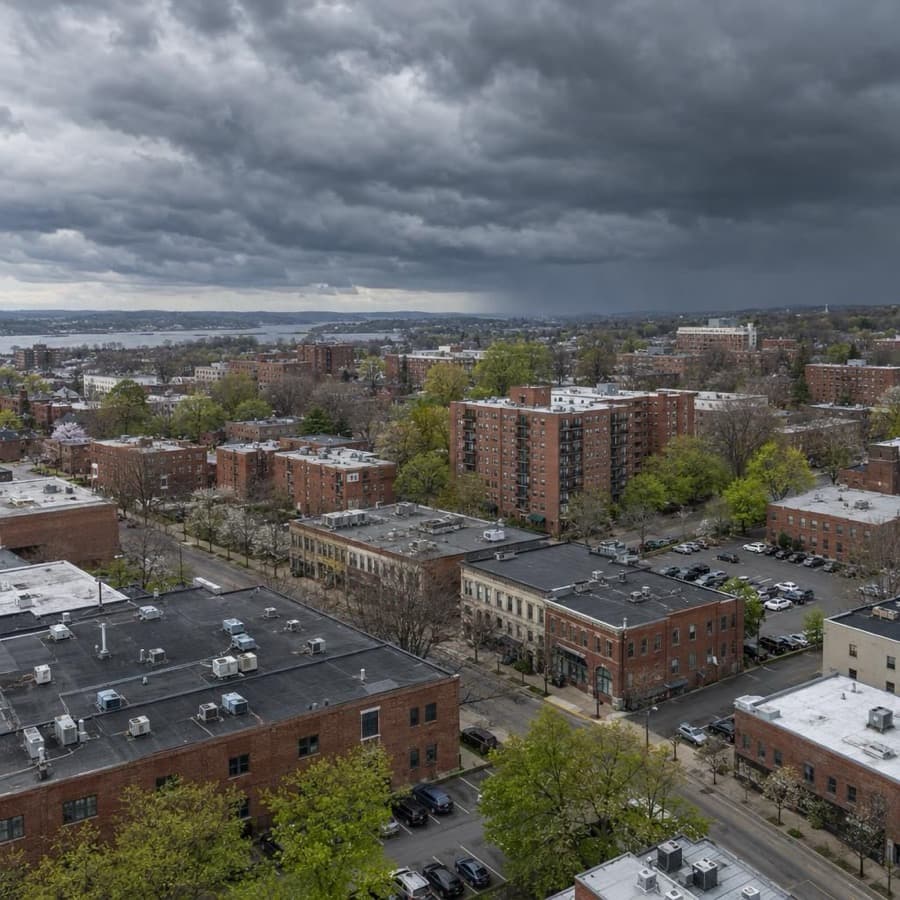
- Hail days near Springfield since 2010, the most in Massachusetts
- 42
- Largest hail reported, near Springfield
- 3.0 in
- Massachusetts cities tracked
- 3
Source: NOAA/NWS Storm Prediction Center
Data through November 1, 2026
Massachusetts cities by hail days
Source: NOAA/NWS Storm Prediction Center
Data through November 1, 2026
| City | Hail days since 2010 | Largest hail |
|---|---|---|
| Springfield | 42 | 3.0 in |
| Boston | 32 | 2.0 in |
| Worcester | 26 | 2.0 in |
About this data
- Each city counts reports within 15 miles of its center, not of any one property.
- Reports come from trained spotters and the public, so they cluster near towns and roads.
- No report does not mean no hail. Hail can fall where no one is there to report it.
- This is not a damage or insurance assessment.
Storm risk in Massachusetts
The Massachusetts state hazard plan names inland and coastal flooding and severe winter weather and nor'easters among the hazards that occur most often and reach the most people and property. Damaging thunderstorm wind and hail follow, while hurricanes and tornadoes are rare but can cause large local losses.3 Hurricanes are rare: Massachusetts has taken 12 direct hurricane hits from 1851 to 2018, 1 of them major, against 120 in Florida and 64 in Texas.4
How often storms hit Massachusetts
| Hazard | How often | What it means for buildings |
|---|---|---|
| Winter storms and nor'easters | Among the state's most frequent hazards. Of the four Presidentially declared disasters in Massachusetts since 2018, three were severe winter storm and flooding events. | Heavy snow, drifts and ice load roofs: IBHS says 1 inch of ice weighs about as much as a foot of snow, and drifts pile up at parapets and rooftop units. Ice dams back meltwater into buildings. |
| Flooding | Inland and coastal flooding are among the hazards that occur most often. NOAA listed 20 coastal flooding events in Massachusetts from 2018 to 2022. | Surge and high tides flood ground floors, garages and mechanical rooms on the coast; heavy rain floods basements and low sites inland. |
| Damaging thunderstorm wind | Damaging wind reports on 22 days a year on average within 124 nautical miles of the Boston (Taunton) radar (1980 to 2006), the most common severe storm report there. | Microbursts and squall lines drop trees on roofs and cars and tear off roof edges and siding. |
| Hail | Hail on 12 days a year on average within 124 nautical miles of the Boston radar (1980 to 2006). Hail days since 2010 within 15 miles of the city center: Springfield 42, with hail up to 3 inches; Boston 32 and Worcester 26, each with hail up to 2 inches. | Less frequent than in the plains, but stones of 2 inches or more still break skylights, dent metal and damage roof covers and rooftop units. |
| Hurricanes and tropical storms | 12 hurricanes struck Massachusetts from 1851 to 2018: 7 at Category 1, 4 at Category 2 and 1 at Category 3. | Coastal buildings face wind, windborne debris and storm surge, and storms bring heavy rain and river flooding inland. |
| Tornadoes | Tornadoes on 3 days a year on average near the Boston radar, and NOAA listed 19 in Massachusetts from 2018 to 2022. The yearly chance of a tornado at any one point near the radar is 0.002 percent. | A direct hit on one building is very unlikely, but a strong tornado can tear off roofs and destroy buildings. |
The city counts are days with at least one hail report within 15 miles of each city's center since 2010, so they show how often hail falls near a city, not on one building. The Storm Prediction Center radar figures cover a circle of 124 nautical miles around the radar, which takes in parts of neighboring states, and come from 1980 to 2006 reports.1,2
For an owner, the pattern matters more than any one storm. Winter storms and flooding recur often and hit many buildings at once, while hurricanes and tornadoes are rare at any one address but can cause the largest single losses.
Rules owners in Massachusetts should know
- FAIR Plan: the Massachusetts Property Insurance Underwriting Association (MPIUA) is the state's market of last resort for owners who can't get coverage from private insurers, and an applicant must certify a reasonable effort to find insurance elsewhere. Its commercial program, which includes buildings with 5 or more apartments or condominiums, uses the Standard Property Policy (CP 00 99) with limits up to $1,000,000 for a single interest and $1,500,000 for multiple interests at one location.5,6
- Proof of loss and payment: under the Massachusetts standard fire policy (General Laws chapter 175, section 99), the insured gives immediate written notice of a loss and a sworn proof of loss. The insurer then has 30 days to pay or replace the property, and owes interest at 1 percent over the prime rate on an agreed amount starting 30 days after it receives an executed proof of loss.7
- Disputes and suit deadline: when the two sides disagree on the amount of loss, it goes to three disinterested referees, a step that comes before any lawsuit unless both waive it. A suit must start within two years of the loss, or no sooner than 90 days after a valid referee award (chapter 175, section 99).7
- Liens and building officials: before paying a loss of $5,000 or more on real property other than owner-occupied one to four family homes, the insurer must get a certificate of municipal liens and pay the city or town any outstanding amounts first. For building damage of $1,000 or more, it must give the local building official and the board of health or select board 10 days' written notice before paying (chapter 175, section 99).7
- Unfair claim practices: chapter 176D lists unfair claim settlement practices, including failing to affirm or deny coverage within a reasonable time after proof of loss is complete and forcing insureds to sue by offering substantially less than they later recover. Under chapter 93A, section 11, a business that loses money or property through another business's unfair or deceptive act may sue, and a willful or knowing violation brings two to three times actual damages plus attorneys' fees.8,9
Before the next storm
- Hurricane season roof check: the Atlantic season runs June 1 to November 30, per the National Hurricane Center. Before it starts, check roof edge metal and membrane perimeters; IBHS recommends a perimeter peel-stop 1 to 2 feet from the edge on single-ply roofs.11,12
- Snow load watch: after heavy snow, have a qualified person estimate the load on the roof. IBHS advises removing snow when the load exceeds 20 to 25 pounds per square foot, and notes that 10 to 12 inches of new snow adds about 5.10
- Clear roof drains: keep drains and scuppers free of ice and debris, since IBHS says ice forming around drains on low-slope roofs traps meltwater and adds weight the structure must carry.10
- Heat for pipes and sprinklers: keep heat above 40°F wherever wet sprinkler pipes run and check vacant space often. IBHS calls burst pipes the leading cause of property damage from winter weather and says vacant properties face greater exposure.10
- Flood coverage timing: look up each building's flood zone and flood coverage before nor'easter and hurricane season. FEMA says a new flood policy typically has a 30-day waiting period before it takes effect.13
Sources
Written by the Cloudbreak team. Numbers, dates and rules cite the published sources below.
- 1. Cloudbreak: NOAA/NWS Storm Prediction Center storm reports, as counted on the Cloudbreak hail history page for Massachusetts
- 2. NOAA Storm Prediction Center: BOX (Boston/Taunton) Severe Weather Climatology, 1980 to 2006
- 3. Massachusetts Emergency Management Agency and Executive Office of Energy and Environmental Affairs: ResilientMass Plan, Chapter 5: Risk Assessment and Hazard Analysis (2023 State Hazard Mitigation and Climate Adaptation Plan)
- 4. NOAA Hurricane Research Division (Chris Landsea, NHC): TCFAQ E19: How many direct hits by hurricanes of various categories have affected each state?
- 5. Massachusetts Division of Insurance (Mass.gov): Massachusetts Property Insurance Underwriting Association
- 6. Massachusetts Property Insurance Underwriting Association (MPIUA): Producer Quick Reference
- 7. Massachusetts Legislature: General Laws chapter 175, section 99: Standard form and content of fire insurance policies
- 8. Massachusetts Legislature: General Laws chapter 176D, section 3: Unfair methods of competition and unfair or deceptive acts or practices
- 9. Massachusetts Legislature: General Laws chapter 93A, section 11: Persons engaged in business; actions for unfair trade practices
- 10. Insurance Institute for Business & Home Safety (IBHS): Commercial Risk Engineering Bulletin: Winter Weather
- 11. NOAA National Hurricane Center: Tropical Cyclone Climatology
- 12. Insurance Institute for Business & Home Safety (IBHS): Commercial Roofs Best Practices Guide
- 13. FEMA: Waiting Period for Activating Flood Policy?
Storms in Massachusetts
In SPC's 1980 to 2006 records for the NWS Boston/Norton area, hail reports peaked in June and July and damaging wind reports peaked in July. Wind reports were nearly three times as common as hail.1
Notable storms
- July 23, 2019Two EF1 tornadoes with winds up to 110 mph crossed Cape Cod, one on a 5.5-mile track from Barnstable through Yarmouth and one through Harwich, where a few homes lost shingles. NOAA's Storm Events Database lists $3.6 million in property damage in Harwich and $1.2 million on the Barnstable to Yarmouth track.2,3
- August 4, 2015Storms dropped hail up to 2 inches across, lime size, in Waltham and in Boston's Jamaica Plain neighborhood. Golf ball size hail, 1.75 inches across, fell in Harvard Square.4,5,6
- July 28, 2014An EF2 tornado touched down in Chelsea and crossed central Revere on a 1.9-mile path. It damaged 64 structures, from torn siding to roofs lifted or blown off, and building inspectors declared 13 of them uninhabitable. NOAA's Storm Events Database lists $4 million in property damage.7
- July 18, 2012A microburst with winds of 70 knots (81 mph) hit about a square mile of eastern Arlington, where falling trees damaged numerous houses and vehicles. The same storms dropped hail up to 2 inches across in Dighton.8,9
- July 26, 2011Hail 3 inches across fell in Springfield. Nearby, a microburst with winds estimated at 90 to 100 mph downed hundreds of trees in Wilbraham, some onto buildings, and NOAA's Storm Events Database lists $1.5 million in property damage there.10,11
- June 1, 2011An EF3 tornado with winds estimated at 160 mph tracked 39 miles from Westfield through West Springfield, Springfield, Wilbraham and Monson to Charlton, destroying many homes and tearing roofs off commercial buildings. NOAA's Storm Events Database lists 3 deaths, 200 injuries and $227.6 million in property damage for the day's tornadoes. Hail 4 inches across fell in East Windsor in the Berkshires.12,13,14
Warnings and alerts
NWS Albany covers Berkshire County, and NWS Boston/Norton covers the rest of Massachusetts.15 MEMA says Wireless Emergency Alerts reach enabled phones in the affected area with no sign-up, and it directs residents to their local emergency management director to enroll in town alert systems.16
Sources
- 1. NOAA Storm Prediction Center: BOX Severe Weather Climatology
- 2. NOAA NCEI: Storm Events Database: Barnstable County tornado, Barnstable to Yarmouth, July 23, 2019
- 3. NOAA NCEI: Storm Events Database: Barnstable County tornado in Harwich, July 23, 2019
- 4. NOAA NCEI: Storm Events Database: Middlesex County hail in Waltham, August 4, 2015
- 5. NOAA NCEI: Storm Events Database: Suffolk County hail in Jamaica Plain, August 4, 2015
- 6. NOAA NCEI: Storm Events Database: Middlesex County hail in Harvard Square, August 4, 2015
- 7. NOAA NCEI: Storm Events Database: Suffolk County tornado, Chelsea and Revere, July 28, 2014
- 8. NOAA NCEI: Storm Events Database: Middlesex County thunderstorm wind in Arlington, July 18, 2012
- 9. NOAA NCEI: Storm Events Database: Bristol County hail in Dighton, July 18, 2012
- 10. NOAA NCEI: Storm Events Database: Hampden County hail in Springfield, July 26, 2011
- 11. NOAA NCEI: Storm Events Database: Hampden County thunderstorm wind near Wilbraham, July 26, 2011
- 12. NWS Taunton (Boston): Public Information Statement: Three Tornadoes Confirmed on June 1 2011 in Massachusetts
- 13. NOAA NCEI: Storm Events Database: Hampden County EF3 tornado, June 1, 2011
- 14. NOAA NCEI: Storm Events Database: Berkshire County hail in East Windsor, June 1, 2011
- 15. National Weather Service: Massachusetts County Warning Forecast Areas
- 16. Massachusetts Emergency Management Agency: Be Informed and Receive Emergency Alerts
Hail history in other states
- Alabama
- Alaska
- Arizona
- Arkansas
- California
- Colorado
- Connecticut
- District of Columbia
- Florida
- Georgia
- Hawaii
- Idaho
- Illinois
- Indiana
- Iowa
- Kansas
- Kentucky
- Louisiana
- Maine
- Maryland
- Michigan
- Minnesota
- Mississippi
- Missouri
- Montana
- Nebraska
- Nevada
- New Hampshire
- New Jersey
- New Mexico
- New York
- North Carolina
- North Dakota
- Ohio
- Oklahoma
- Oregon
- Pennsylvania
- Rhode Island
- South Carolina
- South Dakota
- Tennessee
- Texas
- Utah
- Virginia
- Washington
- West Virginia
- Wisconsin
- Wyoming