Facility condition index
Inspection · Cloudbreak team · Updated October 29, 2026 · 6 sources
Definition
The facility condition index (FCI) is the ratio of a building's deferred repair costs to its current replacement value. It is a simple measure of relative condition at one point in time: the higher the FCI, the worse the condition.
How it works
FCI = cost of deferred repairs / current replacement value. The top of the fraction is repair and renewal work that should already have been done and wasn't. The bottom is what it would cost to replace the building as it is.
Agencies word the parts a little differently. GSA defines FCI as total deferred repair and alteration needs divided by the asset's functional replacement value, and deferred maintenance as maintenance and repairs that were not performed when they should have been or were scheduled to be. Work that expands an asset's capacity is excluded.1
Replacement value is the cost to replace the facility at its existing size and functional capability. A 2003 federal school facilities guide computes it as the building's gross square footage times the estimated cost per square foot to design and build new.2,3
Repair needs are priced in dollars rather than graded, because adding up good, fair and poor ratings would need a complex and subjective weighting formula. Both estimates are easy to bend, the same guide warns: where people want a building replaced, replacement value can be underestimated and repair costs overestimated, which pushes the FCI up.2
Reading the number
A low FCI means little deferred work for the building's value, and a high one means a large backlog. Agencies that rate FCI set their own bands. The National Park Service, for example, rates an FCI under 0.10 as good and over 0.50 as serious:4
| FCI | Rating |
|---|---|
| Under 0.10 | Good |
| 0.11 to 0.14 | Fair |
| 0.15 to 0.49 | Poor |
| Over 0.50 | Serious: strongly consider stabilization or restoration (heritage assets) or replacement (non-heritage assets) |
Not every system computes it the same way. The Army Corps of Engineers' BUILDER system reports [1 minus (current repair needs / plant replacement value)] x 100, where a higher number means better condition.5
Example
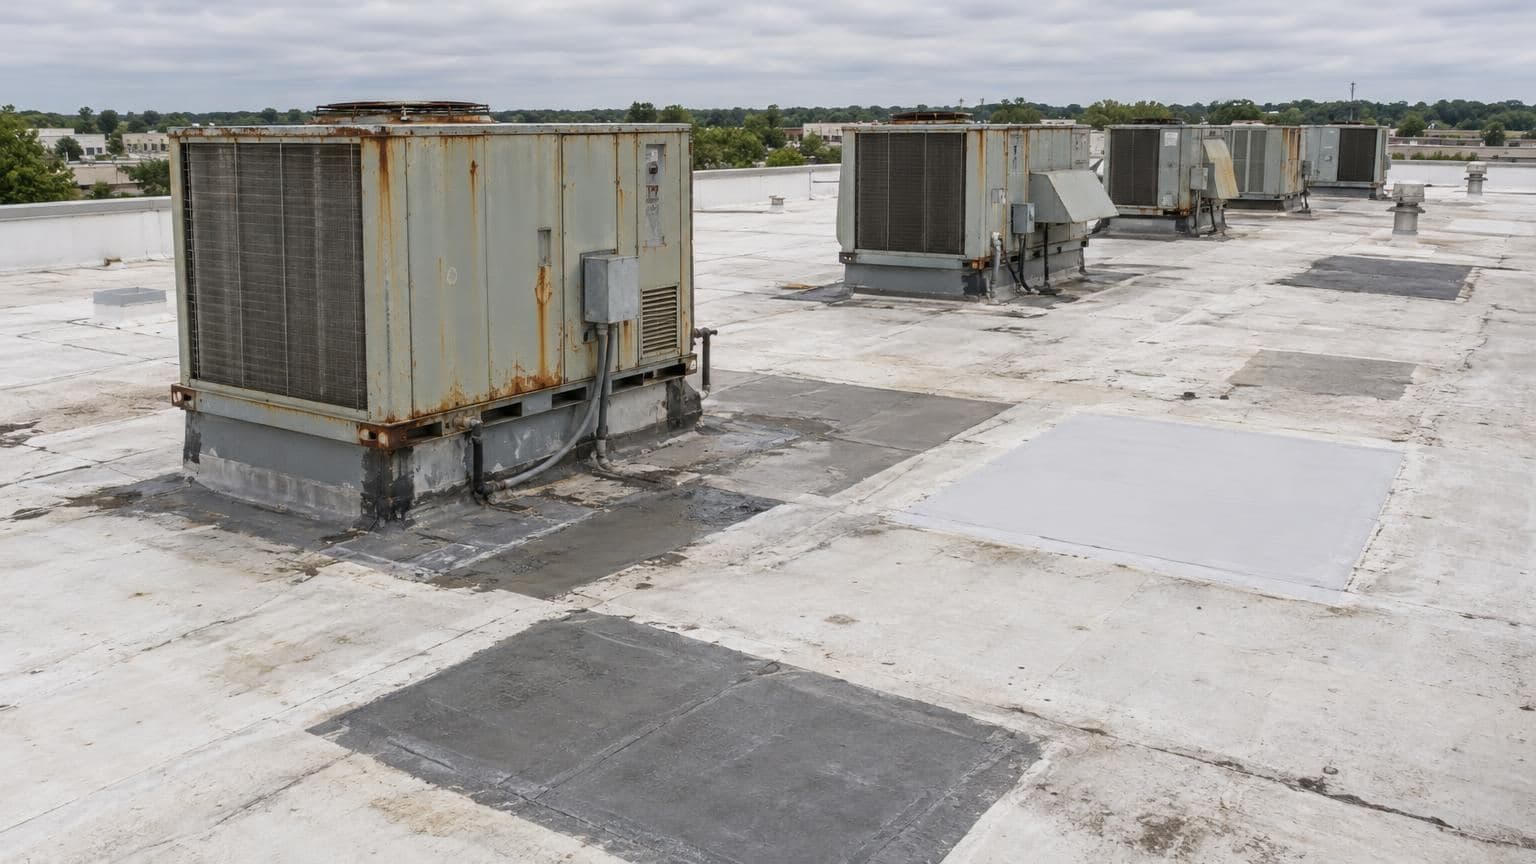
Example inputs: a 180,000-square-foot apartment complex at an estimated $200 per square foot to build new has a replacement value of $36,000,000. A condition assessment prices $2,700,000 of deferred repairs: a roof past its service life, failing rooftop units and worn paving. FCI = $2,700,000 / $36,000,000 = 0.075, good on the Park Service scale.4,2
If another $3,000,000 of roof and HVAC work is put off, the FCI becomes $5,700,000 / $36,000,000 = 0.158, which the Park Service rates poor. Officials at six federal agencies told GAO in 2008 that postponing repairs generally leads to higher operating and maintenance costs, for example when a roof due for replacement is patched again and again.4,6
Where you'll see it
- Facility condition assessments and capital plans for groups of buildings, where the FCI ranks which buildings need repair money first.
- School and campus capital plans: the 2003 federal school facilities guide calls the FCI a nationally recognized standard adopted by NACUBO and APPA, used to decide whether to modernize or replace a building.2
Questions
- How do you calculate facility condition index?
- Divide the total cost of deferred repairs by the building's current replacement value. A building with $100,000 of deferred repairs and a $1,000,000 replacement value has an FCI of 0.10.1,4
- What is a good FCI?
- Lower is better, and each agency sets its own bands. The National Park Service rates an FCI under 0.10 as good, 0.11 to 0.14 fair, 0.15 to 0.49 poor and over 0.50 serious. GSA counts an FCI of 10% or less as good condition.1,4
- When does FCI suggest replacing a building?
- When repairs approach the cost of building new. The 2003 federal school facilities guide says that if the FCI is greater than 1, replacing a school may be more cost-effective than modernizing it. The Park Service says to strongly consider replacing non-heritage assets with an FCI over 0.50.4,2
- Why do some reports show FCI on a 0 to 100 scale?
- Some systems invert the ratio. BUILDER reports [1 minus (repair needs / plant replacement value)] x 100, so 100 is best, while the ratio form rises as condition gets worse.5
Cloudbreak
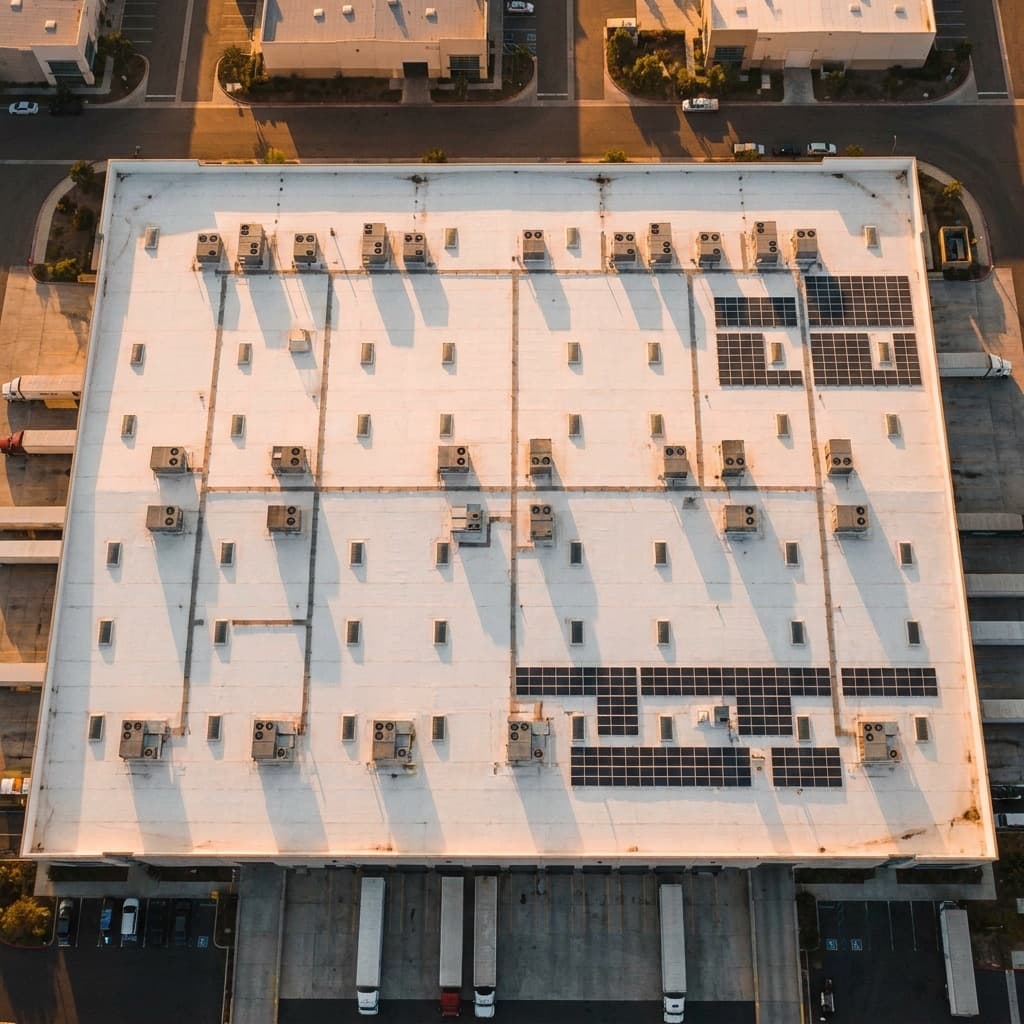
Cloudbreak's certified inspection partners record every roof section, elevation and exterior item before a loss, with an exception list for anything not captured. Before a purchase, the due diligence inspection covers storm risk, roof life and insurance cost.
Sources
Written by the Cloudbreak team. Numbers, dates and rules cite the published sources below.
- 1. U.S. General Services Administration: FY 2022 Agency Financial Report, Required Supplementary Information: Deferred Maintenance and Repairs
- 2. National Center for Education Statistics, U.S. Department of Education: Planning Guide for Maintaining School Facilities, Chapter 3: Using Data Elements for Analysis (2003)
- 3. U.S. National Park Service: NPS Asset Inventory Summary, Mount Rainier National Park, as of September 30, 2018
- 4. U.S. National Park Service, Denver Service Center: Definitions: F (Facility Condition Index)
- 5. U.S. Army Corps of Engineers, Engineer Research and Development Center: BUILDER glossary: Facility Condition Index
- 6. U.S. Government Accountability Office: Federal Real Property: Government's Fiscal Exposure from Repair and Maintenance Backlogs Is Unclear, GAO-09-10 (October 16, 2008)