How to find the wind speed at an address on a date
Short answer
No single record gives the wind at one address. Build the answer from three kinds of record: the nearest airport stations' hourly winds and peak gusts, the storm reports and damage surveys for that day, and an analyzed wind grid over the address. For the grid, NOAA's URMA analysis estimates hourly wind and gust on a 2.5 km (1.6 mile) grid. For hurricanes, National Hurricane Center records add the storm's track, peak winds and station readings.1 Airport stations average about 44 km (27 miles) apart, likely too coarse to reliably catch a downburst's peak winds, so a calm station reading does not rule out damaging wind at the building.2
Cloudbreak team · Updated October 28, 2026 · 6 min read · 21 sources
Where the records are
| Record | What it gives | Coverage | Times and units |
|---|---|---|---|
| NCEI Local Climatological Data | Hourly wind and gusts, daily peak and fastest 2-minute wind | About 1,000 U.S. stations since 2005 | Local standard time; mph on PDFs |
| Iowa Environmental Mesonet | Airport observations with peak wind remarks | Airports worldwide; one-minute U.S. ASOS from 2000 | Knots; time zone of choice |
| SPC Storm Reports | Preliminary wind reports | June 1, 1999 to today | UTC; mph |
| NCEI Storm Events Database | Final wind events, measured or estimated | January 1950 to a few months ago | Knots; usually local standard time |
| NWS Damage Assessment Toolkit | Preliminary survey points with wind speeds | Events NWS surveyed | UTC |
| NOAA URMA | Hourly 10 m wind speed, direction and gust | 2.5 km grid from January 28, 2014 | Hourly GRIB2 files |
| NHC HURDAT2 and Tropical Cyclone Reports | Storm center, peak wind, wind radii, station tables | Atlantic storms 1851 to 2025 | UTC; knots |
Step 1: the nearest airport stations
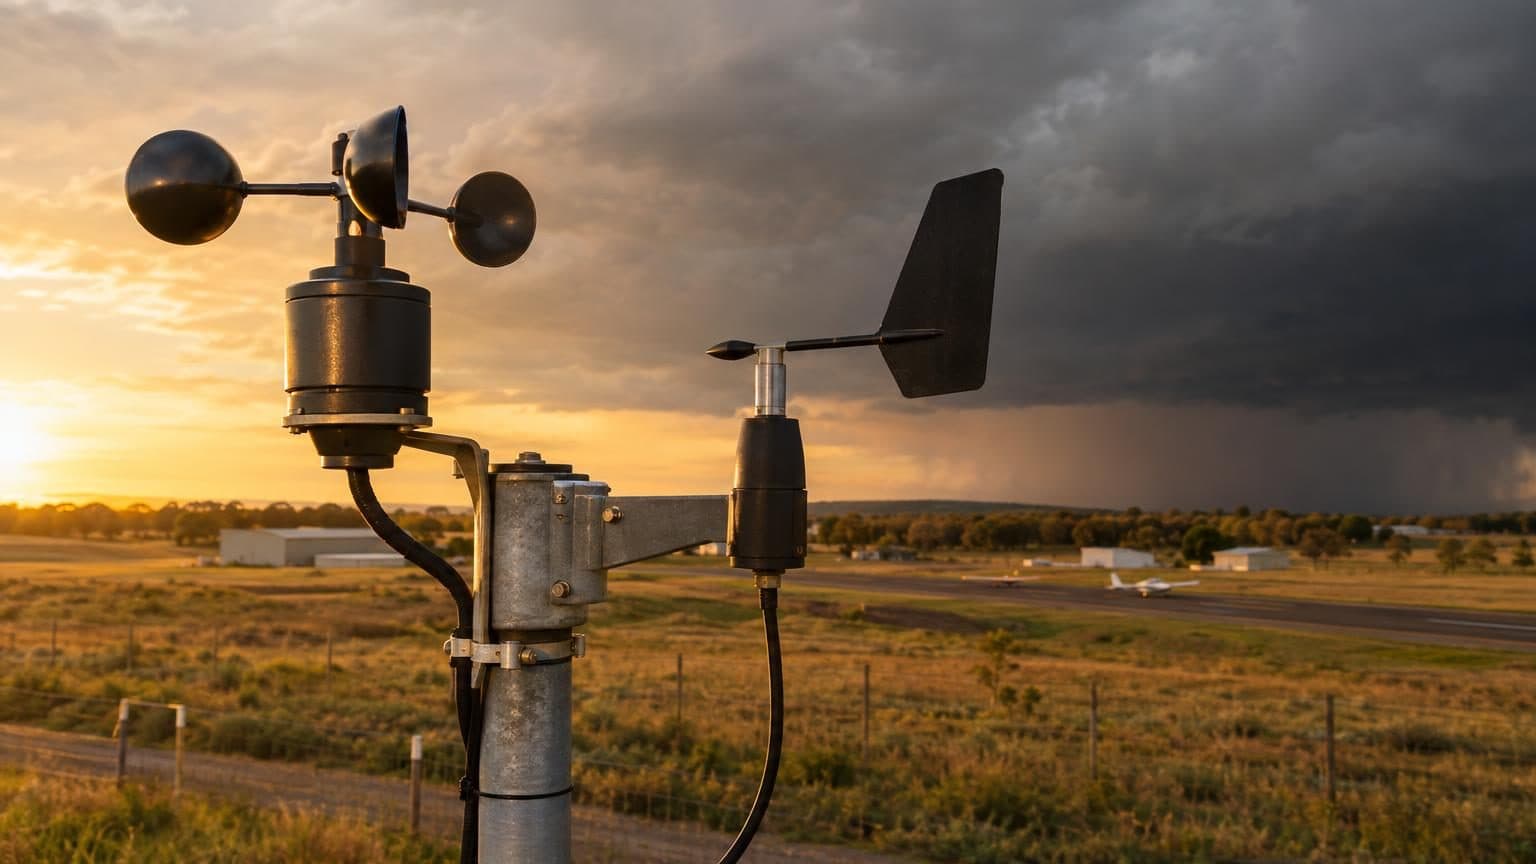
Airport weather stations are the main source of measured wind. The Automated Surface Observing System (ASOS), run by the NWS, the FAA and the Defense Department, has more than 900 U.S. sites. Find the two or three closest to the property and pull the hours around the storm.15
- Height: federal standards call for 10 m (32.8 feet), with some variance; typical ASOS sensors sit at 33 or 27 feet (1998 user's guide).16
- Sustained wind: a 2-minute average of 24 five-second averages.16,17
- Gusts: the highest 5-second average on older cup sensors; the sonic sensors that replaced them from 2003 to 2005 use the highest 3-second running average, the WMO gust standard, and report more gusts (2003 NWS notice).16,17
- Peak wind: scheduled hourly reports add the highest wind above 25 knots since the last hourly report. The Iowa Environmental Mesonet parses it, with its time, from the PK WND remark, but does very little quality control.16,6
NCEI's Local Climatological Data (LCD) adds the daily fastest sustained wind (held at least 2 minutes since 1994) and the raw METAR text, in local standard time with no daylight saving.4
For a claim or lawsuit, NCEI certifies LCD PDFs, which can be ordered for litigation, and fees may apply; Storm Events reports are certified by sending search results to ncei.orders@noaa.gov.3,5,9
Step 2: storm reports and damage surveys
Storm reports show whether the NWS logged damaging wind near the property that day, measured or estimated. SPC Storm Reports list preliminary, thunderstorm-related local storm reports from NWS offices back to June 1, 1999; each date runs from 1200 UTC to 1159 UTC the next day. The list likely misses some reports and leaves out any that arrived more than 10 days late.7,8
The NCEI Storm Events Database holds the official, final NWS Storm Data from January 1950 and takes a few months to compile. Its wind events:9,7
- Thunderstorm Wind: convective winds of 50 knots (58 mph) or more, or any speed that causes a fatality, injury or damage; filed by county.18,10
- High Wind: non-convective sustained winds of 35 knots (40 mph) for 1 hour or more, or gusts of 50 knots (58 mph) or more (higher in some mountains); filed by forecast zone.18,10
- Each event has a magnitude in knots and a code: MG measured gust, EG estimated gust, MS measured sustained, ES estimated sustained.10,18
When speeds are estimated from damage, the preparer weighs the age, construction and exposure of what was damaged; damage alone does not automatically imply 50 knot winds.18
Where the NWS surveyed damage, Damage Assessment Toolkit points carry a location, dates, damage, degree of damage, rating (EF number, or TSTM or Wind) and wind speed. The data is preliminary; official statistics are in Storm Data.12,11
EF scale winds are damage-based estimates of 3-second gusts, not the same wind as station observations. Its 28 damage indicators include strip malls, warehouses, metal building systems and apartments of 3 stories or less.19
Step 3: the URMA wind grid over the address
URMA (UnRestricted Mesoscale Analysis) fills the space between stations. It is NOAA's hourly surface weather analysis, with 10 m wind speed, direction and gust on a 2.5 km (1.6 mile) grid over the lower 48 states, with files from January 28, 2014, on NCEI and NOAA's Amazon Web Services bucket.1
It runs 6 hours after analysis time to catch late observations and is the NWS analysis of record for verifying forecasts. It blends observations into a first guess from the HRRR and NAM models, so it is an analysis, not a measurement.20,1
For hurricanes: best tracks and station tables
NHC's HURDAT2 best track lists each Atlantic storm's position, maximum winds and central pressure every 6 hours from 1851 to 2025, and its size from 2004.13
- Maximum sustained wind is the highest 1-minute average wind in the storm at 10 m with unobstructed exposure, in knots.14
- Wind radii, from 2004 on, give the farthest reach of 34, 50 and 64 knot winds in each quadrant; landfalls are marked L.14
Tropical Cyclone Reports add station tables; Harvey's gives sustained winds as 2-minute averages on land and 8-minute at buoys unless noted.13,21
Station coverage can miss the worst of a storm. In Harvey, NHC wrote, the northeastern quadrant came ashore in an unpopulated, unmonitored area and the maximum winds were probably not sampled by any anemometer; an instrument near Copano Bay failed before the highest winds arrived.21
Limits of every record
- Station spacing: a 2024 SPC study lists average spacing of 44 km (27 miles) for ASOS and AWOS, 35 km (22 miles) for the West Texas Mesonet and 30 km (19 miles) for the Oklahoma Mesonet.2
- Downburst size: in simulated downbursts, severe winds covered about 10 square km (4 square miles) or less for about 5 minutes on average, and a typical mesonet's chance of measuring a severe gust was about 1%.2
- Exposure: a sheltered station can read lower than the open wind.
- Averaging times: EF scale 3-second gusts, NHC 1-minute winds and ASOS 2-minute winds are not the same wind, so compare like with like.19,16,14
- Time zones: LCD uses local standard time and Storm Events usually does; SPC, NHC and the damage toolkit use UTC.4,10,8,14,12
How Cloudbreak helps
Free hail history
Every hail and wind day near any address since 2010, with a free PDF and storm alerts.
Portfolio hail report
Hail history for up to 100 addresses at once, free.
Storm monitoring
Our proprietary predictive storm engine, built with AI and backed by meteorologists, watches every building against its own roof-based thresholds; our on-call team picks up urgent matches within 15 minutes, day or night.
Questions
- How do I find out how strong the wind was at my property on a specific date?
- Pull the nearest airport stations' hourly winds and gusts from NCEI Local Climatological Data or the Iowa Environmental Mesonet, then check SPC storm reports, Storm Events, NWS damage surveys and the URMA grid cell over the address.6
- Where can I get historical wind speed data for an address?
- Station records come from NCEI Local Climatological Data and the Iowa Environmental Mesonet; URMA gives analyzed hourly wind and gust on a 2.5 km grid from January 28, 2014.3,6,1
Cloudbreak
The owner-side property protection team for commercial and multifamily owners in storm country: a dated record of every building, nightly storm checks and a review of your policy, before a loss.
Sources
Written by the Cloudbreak team. Numbers, dates and rules cite the published sources below.
- 1. NOAA National Centers for Environmental Information: UnRestricted Mesoscale Analysis (URMA): Dataset Metadata
- 2. American Meteorological Society: Investigating the Near-Surface Wind Fields of Downbursts Using a Series of High-Resolution Idealized Simulations (Moore, Weather and Forecasting, 2024)
- 3. NOAA National Centers for Environmental Information: Local Climatological Data (LCD)
- 4. NOAA National Centers for Environmental Information: Local Climatological Data Version 2 (LCDv2) Dataset Documentation
- 5. NOAA National Centers for Environmental Information: Local Climatological Data (LCD), Version 2: Dataset Metadata
- 6. Iowa Environmental Mesonet, Iowa State University: Download ASOS/AWOS/METAR Data
- 7. NOAA Storm Prediction Center: SPC Frequently Asked Questions
- 8. NOAA Storm Prediction Center: Storm Prediction Center Today's Storm Reports
- 9. NOAA National Centers for Environmental Information: Storm Events Database
- 10. NOAA National Centers for Environmental Information: Storm Data Bulk Data Format
- 11. NOAA National Weather Service: NWS Damage Assessment Toolkit: Damage Viewer Service
- 12. NOAA National Weather Service: NWS Damage Assessment Toolkit: Damage Points Layer
- 13. NOAA National Hurricane Center: NHC Data Archive
- 14. NOAA National Hurricane Center: The Revised Atlantic Hurricane Database (HURDAT2), April 2022
- 15. NOAA National Centers for Environmental Information: Automated Surface/Weather Observing Systems (ASOS/AWOS)
- 16. NOAA, Department of Defense, Federal Aviation Administration and U.S. Navy: Automated Surface Observing System (ASOS) User's Guide (March 1998)
- 17. NOAA National Weather Service: Technical Implementation Notice 03-15: ASOS Wind Sensor Replacement (March 19, 2003)
- 18. NOAA National Weather Service: NWS Instruction 10-1605: Storm Data Preparation (July 26, 2021)
- 19. NOAA Storm Prediction Center: Enhanced Fujita Tornado Damage Scale
- 20. NOAA NCEP Environmental Modeling Center: Real-Time Mesoscale Analysis and UnRestricted Mesoscale Analysis (RTMA/URMA)
- 21. NOAA National Hurricane Center: Tropical Cyclone Report: Hurricane Harvey, August 17 to September 1, 2017