Hurricane Kate (1985)
Hurricane Kate was a Category 3 hurricane at its peak, with 121 mph winds and a lowest pressure of 954 mb, per NOAA's National Hurricane Center. Modeled winds reached tropical-storm force (39 mph) at 5 of the cities we track; the strongest was Tallahassee, FL, with a modeled peak gust of 89 mph.
- Peak strength121 mph winds (1-minute)
- Category 3
- Cities with tropical-storm-force windsModeled, of the cities we track
- 5
- LandfallsFirst November 21, 1985
- 1
- Lowest pressure
- 954 mb
Track, wind field and cities
Select a piece of the track or a city for details.
- Depression or weaker
- Tropical storm
- Hurricane, Category 1 or 2
- Major hurricane, Category 3 to 5
- Landfall
- City (larger ring, stronger modeled gust)
- Modeled wind field, 39 to 111 mph sustained (darker, stronger; orange 111 mph+)
The shaded areas are where our model puts Hurricane Kate’s sustained winds over open land at 39 mph or more (tropical-storm force), 58, 74 (hurricane force) and 111 mph (major hurricane force) at some point along its track. Modeled, not measured. How we model hurricane winds
Landfalls
- November 21, 1985, Category 2 at 98 mph, about 75 miles from Tallahassee, FL
Modeled winds at cities (5)
Estimated peak winds for open, flat ground at each city’s center. Not measurements. How we model hurricane winds
| City | Peak gust | Sustained | Closest pass | Peak |
|---|---|---|---|---|
| Tallahassee, FL | 89 mph | 73 mph | 22 miles | Nov 21, 1985, 8:15 PM EST |
| Savannah, GA | 57 mph | 47 mph | 38 miles | Nov 22, 1985, 6:30 AM EST |
| Hilton Head Island, SC | 55 mph | 45 mph | 42 miles | Nov 22, 1985, 8:00 AM EST |
| Charleston, SC | 53 mph | 43 mph | 28 miles | Nov 22, 1985, 10:00 AM EST |
| Pensacola, FL | 48 mph | 39 mph | 104 miles | Nov 21, 1985, 12:45 PM EST |
What happened
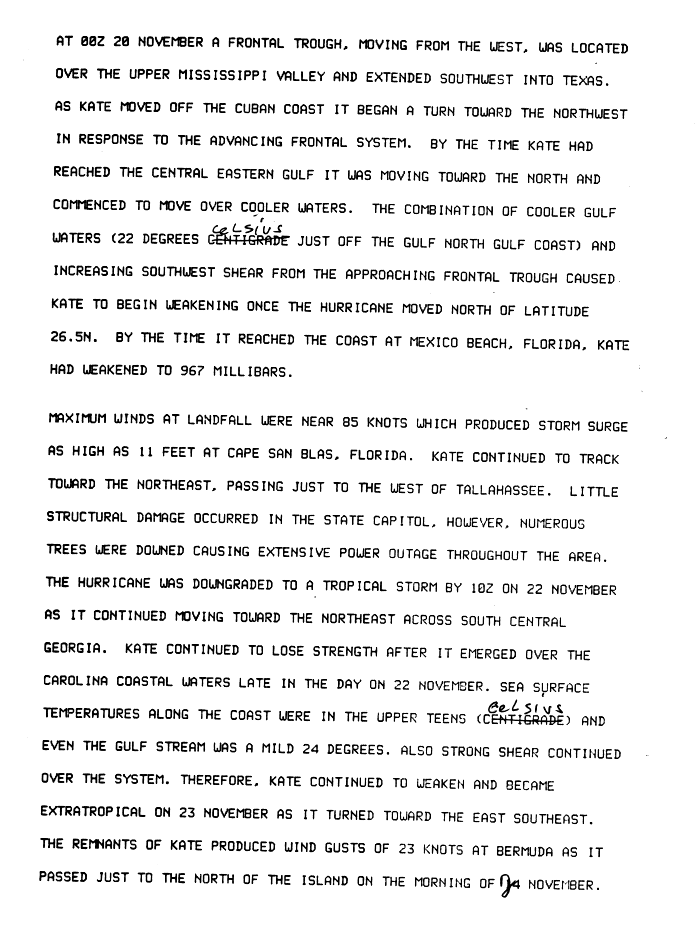
Kate came ashore at Mexico Beach, Florida, at about 5:30 p.m. EST on November 21, 1985, as a Category 2 hurricane with 85-knot (98 mph) winds and a 967 mb central pressure.1,2 It tracked northeast just west of Tallahassee and weakened to a tropical storm over south-central Georgia early on November 22.2
Storm surge reached 11 feet at Cape San Blas, 6 feet at Cedar Island and Keaton Beach, and 5 feet at Turkey Point.2,3 Measured peak gusts included 100 mph at Cape San Blas, 85 mph at Apalachicola, 78 mph at Panama City, 68 mph at Tallahassee and 67 mph at Albany, Georgia.3,4 NHC's preliminary report says Tallahassee had little structural damage but many downed trees and widespread power outages.2 NHC's 1985 annual data report lists $300 million in U.S. damage and 5 deaths for Kate.5
Sources
- 1. NOAA National Hurricane Center: Atlantic hurricane database (HURDAT2), 1851 to 2025
- 2. NOAA National Hurricane Center: Preliminary Report, Hurricane Kate, 15 to 23 November 1985 (page 3)
- 3. NOAA National Hurricane Center: Preliminary Report, Hurricane Kate: selected coastal, data buoy and offshore observations
- 4. NOAA National Hurricane Center: Preliminary Report, Hurricane Kate: Table 3, selected meteorological and hydrological statistics
- 5. NOAA National Hurricane Center: Annual Data and Verification Tabulation, Atlantic Tropical Cyclones 1985 (NOAA Technical Memorandum NWS NHC 29)


Best track (34 positions)
| Time | Status | Wind | Pressure | Position |
|---|---|---|---|---|
| Nov 15, 18:00 UTC | Tropical storm | 40 mph | 999 mb | 21.1°N, 63.8°W |
| Nov 16, 00:00 UTC | Tropical storm | 52 mph | 998 mb | 21.6°N, 63.9°W |
| Nov 16, 06:00 UTC | Tropical storm | 58 mph | 996 mb | 21.7°N, 64.2°W |
| Nov 16, 12:00 UTC | Tropical storm | 63 mph | 993 mb | 21.5°N, 64.8°W |
| Nov 16, 18:00 UTC | Category 1 hurricane | 81 mph | 987 mb | 21.1°N, 65.3°W |
| Nov 17, 00:00 UTC | Category 1 hurricane | 86 mph | 981 mb | 20.7°N, 66.0°W |
| Nov 17, 06:00 UTC | Category 1 hurricane | 86 mph | 984 mb | 20.4°N, 66.4°W |
| Nov 17, 12:00 UTC | Category 1 hurricane | 86 mph | 982 mb | 20.7°N, 67.3°W |
| Nov 17, 18:00 UTC | Category 1 hurricane | 92 mph | 977 mb | 21.1°N, 68.8°W |
| Nov 18, 00:00 UTC | Category 1 hurricane | 92 mph | 976 mb | 21.4°N, 70.0°W |
| Nov 18, 06:00 UTC | Category 1 hurricane | 92 mph | 975 mb | 21.6°N, 71.8°W |
| Nov 18, 12:00 UTC | Category 1 hurricane | 92 mph | 975 mb | 21.6°N, 73.3°W |