Hurricane Hilda (1964)
Hurricane Hilda was a Category 4 hurricane at its peak, with 138 mph winds and a lowest pressure of 941 mb, per NOAA's National Hurricane Center. Modeled winds reached tropical-storm force (39 mph) at 11 of the cities we track; the strongest was Baton Rouge, LA, with a modeled peak gust of 98 mph.
- Peak strength138 mph winds (1-minute)
- Category 4
- Cities with tropical-storm-force windsModeled, of the cities we track
- 11
- LandfallsFirst September 29, 1964
- 2
- Lowest pressure
- 941 mb
Track, wind field and cities
Select a piece of the track or a city for details.
- Depression or weaker
- Tropical storm
- Hurricane, Category 1 or 2
- Major hurricane, Category 3 to 5
- Landfall
- City (larger ring, stronger modeled gust)
- Modeled wind field, 39 to 111 mph sustained (darker, stronger; orange 111 mph+)
The shaded areas are where our model puts Hurricane Hilda’s sustained winds over open land at 39 mph or more (tropical-storm force), 58, 74 (hurricane force) and 111 mph (major hurricane force) at some point along its track. Modeled, not measured. How we model hurricane winds
Landfalls
- September 29, 1964, tropical storm at 40 mph, in Cuba
- October 3, 1964, Category 2 at 104 mph, about 58 miles from Lafayette, LA
Modeled winds at cities (11)
Estimated peak winds for open, flat ground at each city’s center. Not measurements. How we model hurricane winds
| City | Peak gust | Sustained | Closest pass | Peak |
|---|---|---|---|---|
| Baton Rouge, LA | 98 mph | 80 mph | 8 miles | Oct 3, 1964, 6:45 PM GMT-5 |
| Lafayette, LA | 95 mph | 77 mph | 41 miles | Oct 3, 1964, 6:45 PM GMT-5 |
| New Orleans, LA | 80 mph | 65 mph | 41 miles | Oct 3, 1964, 6:45 PM GMT-5 |
| Slidell, LA | 72 mph | 59 mph | 26 miles | Oct 3, 1964, 6:45 PM GMT-5 |
| Lake Charles, LA | 64 mph | 52 mph | 108 miles | Oct 3, 1964, 5:45 PM GMT-5 |
| Gulfport, MS | 62 mph | 50 mph | 17 miles | Oct 4, 1964, 12:15 PM GMT-5 |
| Tallahassee, FL | 50 mph | 41 mph | 25 miles | Oct 5, 1964, 7:15 AM GMT-4 |
| Pensacola, FL | 50 mph | 41 mph | 6 miles | Oct 4, 1964, 11:30 PM GMT-4 |
| Mobile, AL | 50 mph | 41 mph | 8 miles | Oct 4, 1964, 3:15 PM GMT-5 |
| Daphne, AL | 50 mph | 40 mph | 6 miles | Oct 4, 1964, 4:00 PM GMT-5 |
| Jacksonville, FL | 49 mph | 40 mph | 46 miles | Oct 5, 1964, 4:45 PM GMT-4 |
What happened
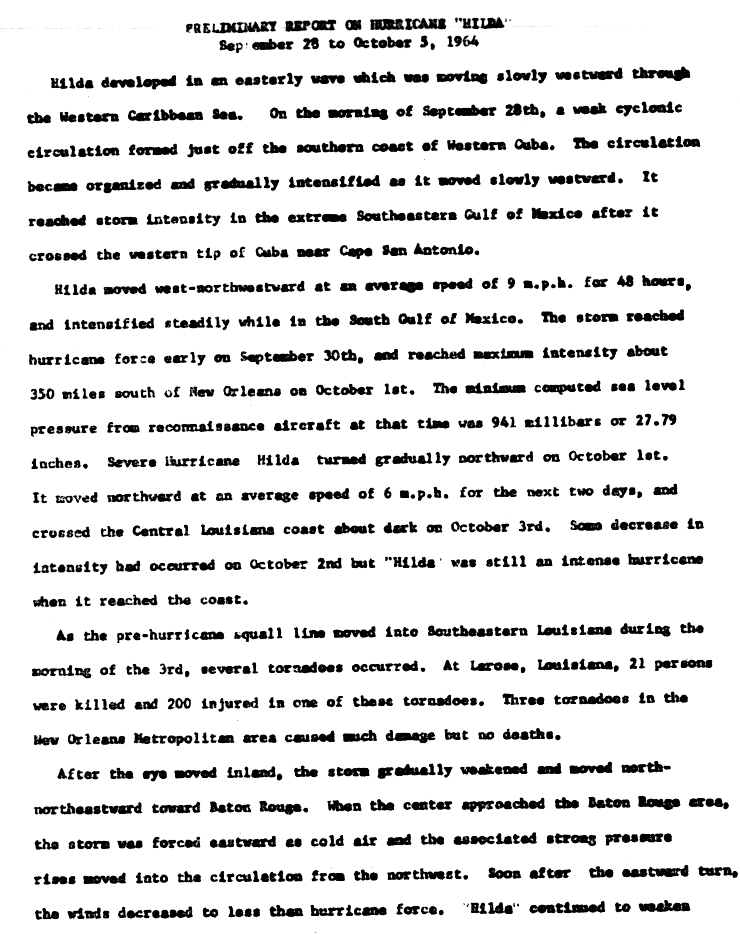
Hilda formed off the south coast of Cuba, crossed the Gulf of Mexico and came ashore at Salt Point in St. Mary Parish, Louisiana, about dark on October 3, 1964.1,2,3 NHC's best track puts the landfall at 2300 UTC as a Category 2 hurricane with 90-knot (104 mph) winds and a central pressure of 959 mb.4 The highest wind reported was 120 mph at Franklin, Louisiana.5
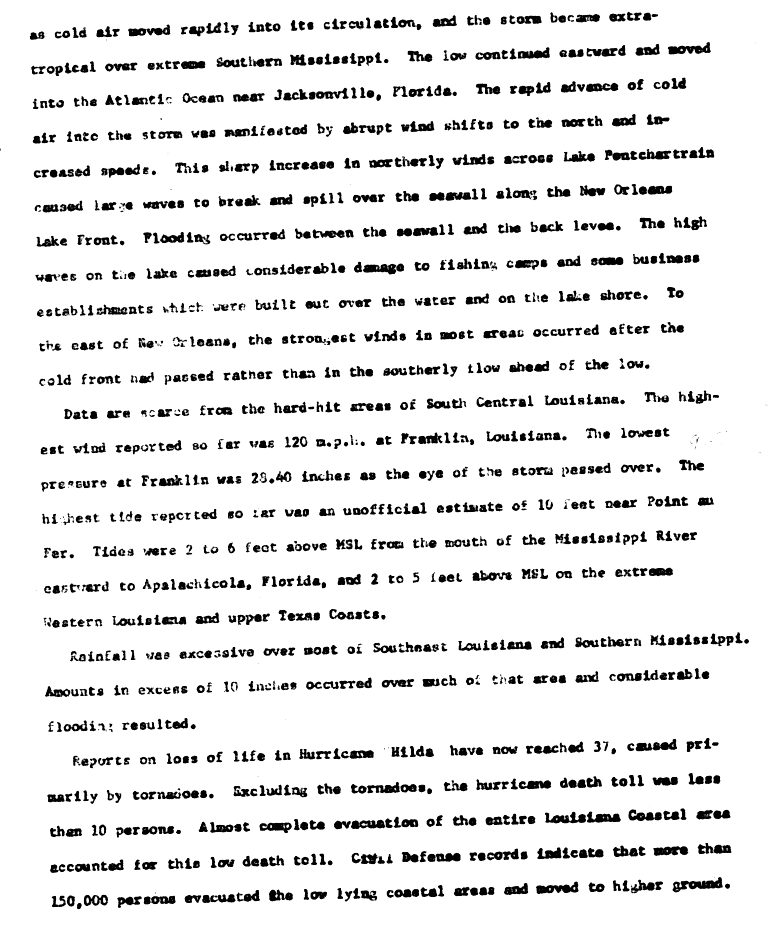
Gulf water reached 7.8 feet deep at Cocodrie and an estimated 10 feet at Point au Fer.3,5 Jeanerette measured 17.71 inches of rain, and storm surge and rain flooding covered three million acres.3 Tornadoes hit Golden Meadow, Galliano, Larose, Kenner, Metairie and New Orleans, and NWS's Louisiana hurricane history says the Larose tornado alone killed 24 people and injured 345.3 On Lake Pontchartrain, waves broke over the New Orleans lakefront seawall, flooded the ground behind it and damaged fishing camps and businesses built over the water.5
The Weather Bureau's preliminary estimate put damage at about $100 million, and NHC counts 38 deaths from Hilda.6,7
Sources
- 1. NOAA Weather Prediction Center: Hurricane Hilda, September 28 to October 5, 1964
- 2. U.S. Weather Bureau (NOAA National Hurricane Center archive): Preliminary Report on Hurricane Hilda, September 28 to October 5, 1964, page 1
- 3. National Weather Service: Louisiana Hurricane History
- 4. NOAA National Hurricane Center: Atlantic hurricane database (HURDAT2), 1851-2025
- 5. U.S. Weather Bureau (NOAA National Hurricane Center archive): Preliminary Report on Hurricane Hilda, page 2
- 6. U.S. Weather Bureau (NOAA National Hurricane Center archive): Preliminary Report on Hurricane Hilda, page 3
- 7. NOAA National Hurricane Center: The Deadliest, Costliest, and Most Intense United States Tropical Cyclones from 1851 to 2010

Best track (39 positions)
| Time | Status | Wind | Pressure | Position |
|---|---|---|---|---|
| Sep 28, 12:00 UTC | Tropical depression | 29 mph | 21.2°N, 80.0°W | |
| Sep 28, 18:00 UTC | Tropical depression | 29 mph | 21.3°N, 81.1°W | |
| Sep 29, 00:00 UTC | Tropical depression | 35 mph | 21.4°N, 82.1°W | |
| Sep 29, 06:00 UTC | Tropical depression | 35 mph | 21.7°N, 83.2°W | |
| Sep 29, 11:00 UTC (landfall) | Tropical storm | 40 mph | 21.9°N, 84.0°W | |
| Sep 29, 12:00 UTC | Tropical storm | 40 mph | 22.0°N, 84.2°W | |
| Sep 29, 18:00 UTC | Tropical storm | 52 mph | 22.4°N, 85.2°W | |
| Sep 30, 00:00 UTC | Tropical storm | 63 mph | 997 mb | 22.8°N, 86.2°W |
| Sep 30, 06:00 UTC | Tropical storm | 69 mph | 994 mb | 23.1°N, 87.2°W |
| Sep 30, 12:00 UTC | Category 1 hurricane | 81 mph | 984 mb | 23.4°N, 88.2°W |
| Sep 30, 18:00 UTC | Category 1 hurricane | 92 mph | 978 mb | 23.8°N, 89.0°W |
| Oct 1, 00:00 UTC | Category 2 hurricane | 98 mph | 977 mb | 24.1°N, 89.5°W |